Reports: Management Floor
An interactive analysis and reporting tool full of carefully prepared ready-made chart and table contents for construction projects. You can open the application from any computer or mobile device without installation and instantly monitor the performance of your projects.
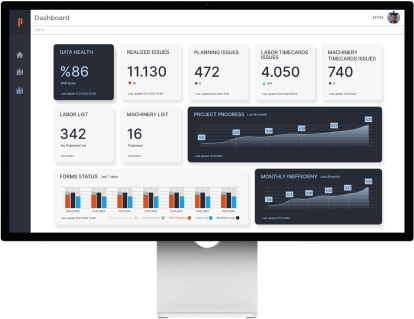
Data Analysis and Visualization
Data Analysis Contents Specific to Construction Projects
Carefully prepared report contents, not random or stereotypical, have been prepared to perform correct performance analyses according to the business logic in construction projects. Control and filter tools have been added and configured separately for each content so that you can extract different information from these contents.
Earned Value Analysis
Ready-made calculations for your project completion rate, success in man-hour or machine-hour planning, and the status of your work schedule.
Different Content Types
Superior tables along with column, pie, and line charts. All prepared: you can start controlling your project successfully right away.
Central Management
Switch Quickly Between Projects
A few clicks are enough to switch to a different project. Additionally, you can set the currency status of the data set for each project by giving a date, so you can be sure that only visually checked data appears before the managers.

Interactive Reporting
Transition from Static Papers to Interactive Visuals
Reports offers you tremendous report screens. All content in these reports is dynamic. It not only brings the most up-to-date data but also offers tools for you to look from different angles. For example, do you want to see the amount of work in the last 7 days instead of the last 1 month in your table? Just tapping 3 times is enough.
Detailed Information
You will find not only summary reports that you would want to browse quickly but also contents that will support you when you want to do detailed analysis.
Controls and Filters
Interactive tools are carefully designed for each content to change the calculation logic or method of the content.
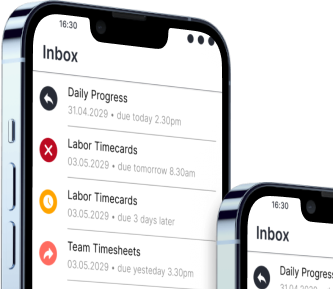
The Automation You Are Looking For
Schematic Reports
It is now automatically generated to show the status of work done in linear projects.
Visually examine the latest status of work done on linear lines thanks to kilometer tracking.
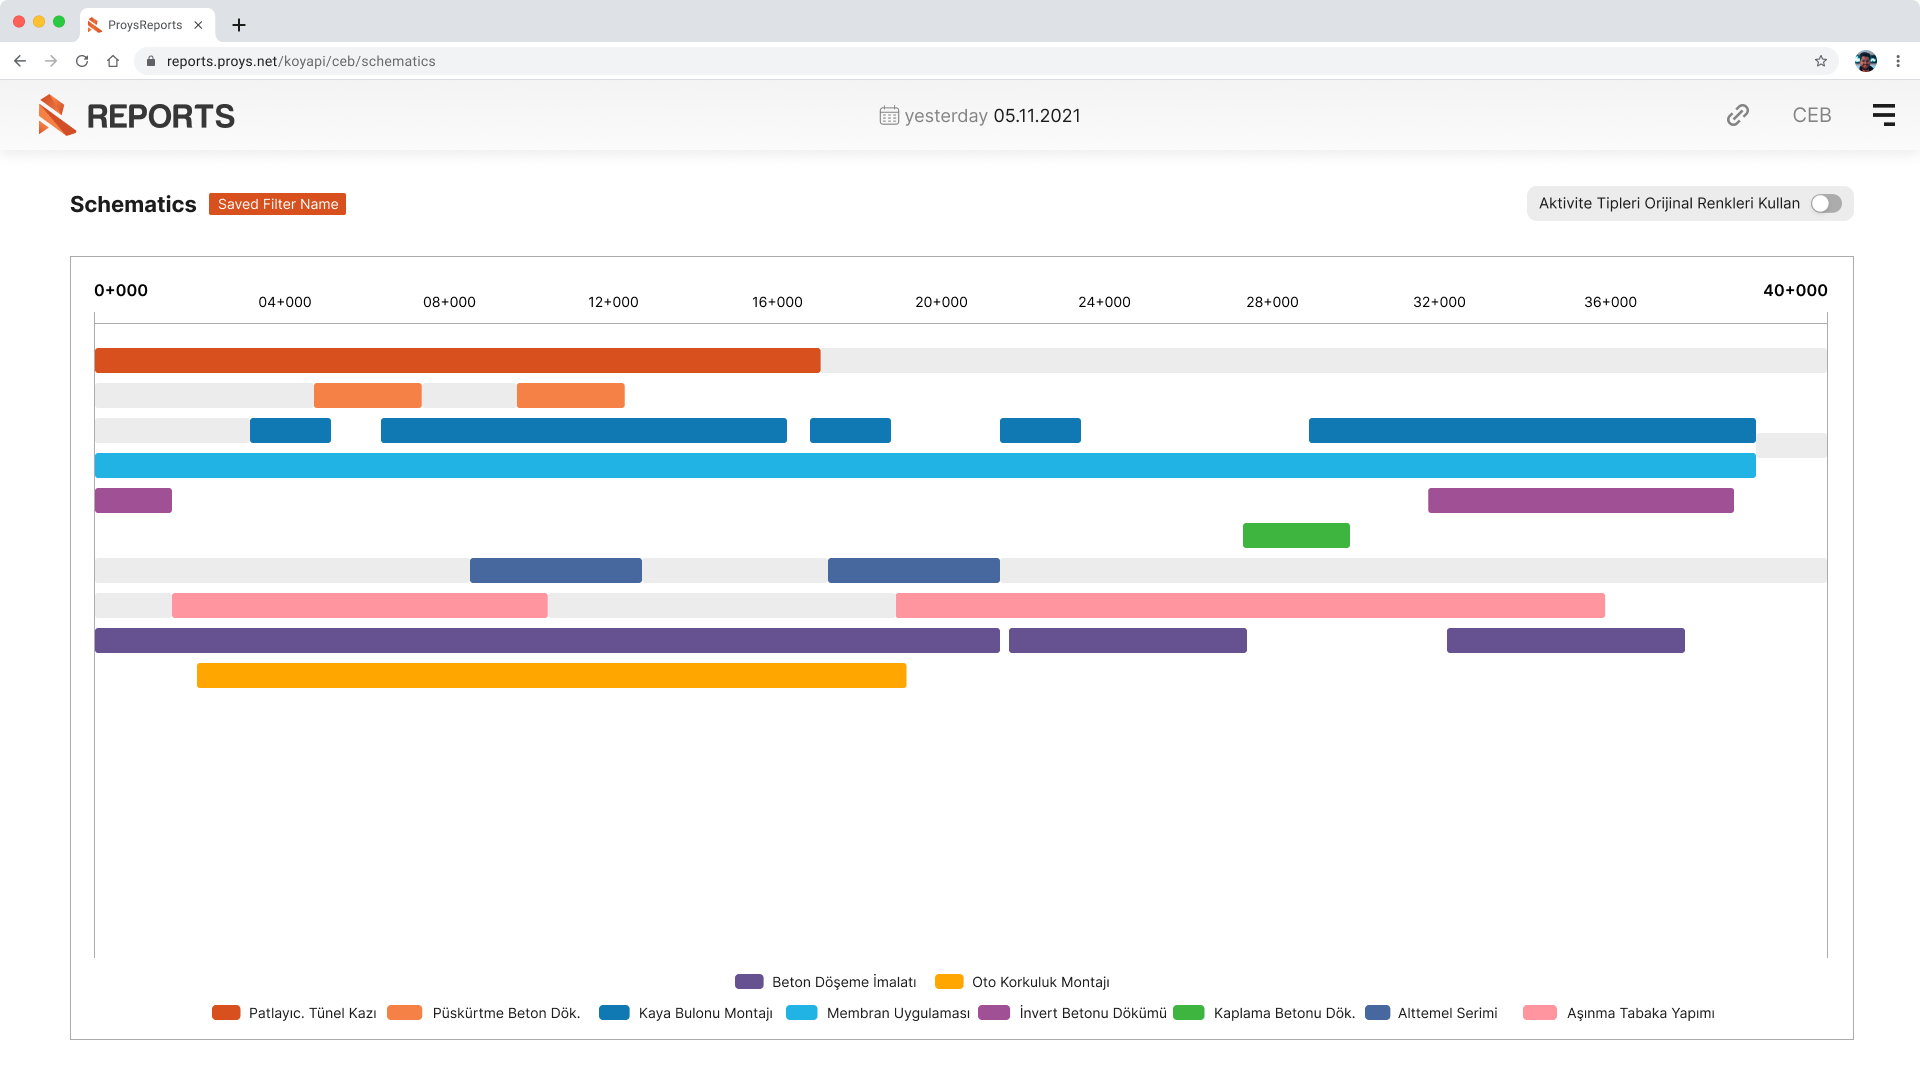
If you want to focus on a certain region, access performance insights specific to that section thanks to interactive features.
A few touches are enough to see where work has been done in the last week or any time interval you want.
Zoom in to see the details more comfortably. You can adjust the beginning and end of the working area that the chart will show.
Formats
Reach Your Needs Quickly with Customizable Contents
For example, you are examining how plan compliance performance has changed for the last 6 months. First you looked for the project in general, then you want to see the situation separately for a discipline. You will be able to limit these needs through filters and controls. You will also find the solution you are looking for so as not to make adjustments every time.
Save Formats
Each content has hundreds of combinations. Save whichever ones you want to have at hand and access them quickly next time.
Share
After naming the formats you saved, you can share them with the users you want.