
Analytic Reporting
Tools designed for you to make deductions that will enable you to take accurate decisions while monitoring the status of your construction sites closely and in real-time.
Data Analytics For Construction Industry
State of the Art Data Analytics
Make decisions based on data, not just observation and intuition.
Time Travel
The Reports↗ product within the PROYS platform provides you with an excellent dashboard. This product, which can make instant calculations for the date and time intervals you want, gives you the opportunity to make analysis based on the most up-to-date information.
Thus, you will always be in a position to understand where your projects have come from to what point and learn from the past. Instead of static paper reports, dynamic charts and tables will allow you to understand well how the performance of your projects changes over time.
Perspective from Different Angles
An advanced user experience has been designed so that you can instantly modify charts and tables according to your current demand.
Next Generation Powerful Infrastructure
Catch the day thanks to infrastructure technologies that have proven themselves with services on a global scale.
Instant Reactions
Do not wait for the reports or up-to-date data you want. Reach the information that reflects the field at any time with a single click.
Ready to Use
You can start using dozens of chart and table contents specially prepared for construction projects immediately.
Schematic Reports
Special Graphic Solutions for Linear Projects
Thanks to graphics specially designed for linear projects, you can get information about the productions made in the field interactively. With the schematic report that comes with the Reports↗ product, you can read which productions have been completed along a line with a bar chart.

Data Analysis and Visualization
Data Analysis Contents Special for Construction Projects
Report contents prepared carefully, not randomly or stereotypically, were prepared in order to make accurate performance analyses according to the business logic in construction projects. Control and filter tools were added and configured separately for each content so that you can draw different results from these contents.
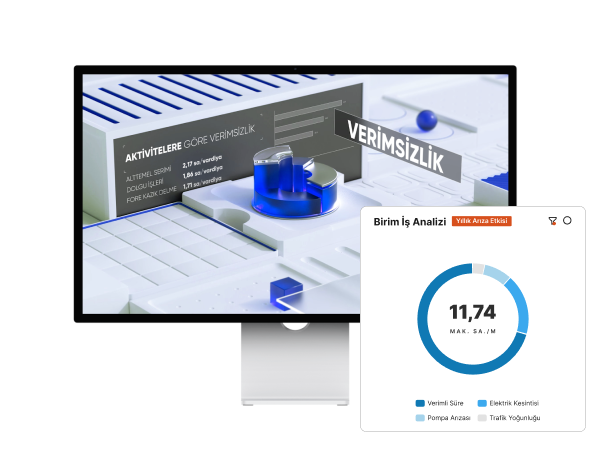
Earned Value Analysis
Ready calculations for your project completion rate, your success in man-hour or machine-hour planning and the status of your work schedule.
Different Content Types
Advanced tables together with bar, pie and line charts. All prepared: you can start controlling your project successfully immediately.
Focus on the Right Points to Keep Under Control
Focus on the Right Points
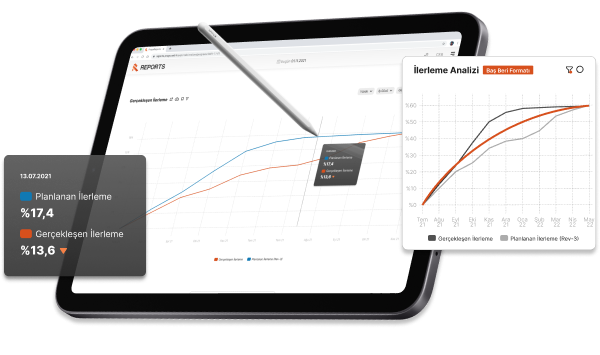
Point-shot analyses where you can follow your goals were prepared for your construction sites.
Compare the general progress of the project with your plan and know if everything is on track. Your S-curves are always ready.

Compare the timesheets of employee types with different costs with planning. Keep your histograms always at hand.

Follow day by day how your construction machines are utilized. Know why you bear high costs and increase efficiency.
Timesheets for measurement works, percentage progress in all concrete works... Cluster and analyze according to your need.
